
Tecomán, Colima
6 properties for sale.
- For sale
- 6
- Municipality population, 2025 · INEGI Intercensal Survey
- 117,565
About Tecomán
ViveMapa lists 6 properties for sale in Tecomán. The municipality had 117,565 residents in 2025 according to INEGI's Intercensal Survey, +1.1% from 2020. The SHF housing price index for Colima (state series) moved +58.6% over five years and +7.1% over the last year, to 2026T2. INEGI (DENUE) records 139 schools, 11 hospitals, 65 pharmacies in Tecomán. In 2025 the intentional homicide rate was 11.9 per 100,000 residents (SESNSP), against 73.4 for the Colima average.
This summary is built only from the figures on this page and their sources, listed at the bottom.
Prices and property types
For sale
| Type | Listings |
|---|---|
| All properties → | 6 |
| House | 2 |
| Land | 2 |
| Hotel | 1 |
| Commercial unit | 1 |
Asking prices as agencies publish them, in the published currency. A median appears only where enough listings carry a price.
Explore Tecomán
Other municipalities in Colima
Map and amenities
- Schools
- Hospitals
- Clinics
- Pharmacies
- Supermarkets
The points nearest the municipality centre, per category.
| Recorded in Tecomán | # |
|---|---|
| Schools (16 private / 123 public) | 139 |
| Universities | 8 |
| Hospitals | 11 |
| Clinics | 133 |
| Pharmacies | 65 |
| Supermarkets | 3 |
| Convenience stores | 63 |
| Banks | 12 |
| Restaurants | 1,392 |
| Gyms | 33 |
INEGI DENUE count (05/2026) by the municipality's own code, not by radius.
Growth and prices
Housing price index, SHF (2T 2026) · state series: Colima
The SHF series do not include this municipality; the Colima series is shown.
Demographics of Tecomán
INEGI, Population and Housing Census 2020 (ITER)
| Indicator | Tecomán municipality | Colima state |
|---|---|---|
| Population aged 0 to 14 | 26.9% | 23.7% |
| Population aged 15 to 64 | 65.5% | 67.8% |
| Population aged 65 and over | 7.6% | 8.5% |
| Average people per household | 3.5 | 3.2 |
| Occupied private dwellings | 33,001 | 226,853 |
| Average schooling, ages 15 and over (years) | 8.2 | 10.1 |
| Economically active population, ages 12 and over | 66.8% | 65.3% |
| Dwellings with internet | 35.7% | 61.1% |
INEGI, Population and Housing Census 2020 (ITER), at locality level. Age shares are of the population whose age was stated. A figure is missing where INEGI withholds it for a very small place.
Security
"Intentional homicides per 100,000 residents" counts the criminal cases the municipality's prosecutor's office opened for intentional homicide that year, scaled to a base of 100,000 residents so places of different sizes can be compared.
Tecomán: 11.9 per 100,000 in 2025; Colima average: 73.4; national average: 15.5.
2026, January to August (8 months, year to date): 10.2 intentional homicides per 100,000; not comparable with the full years.
Municipal reported-case figures (SESNSP), not victim counts and not specific to this neighbourhood or zone.
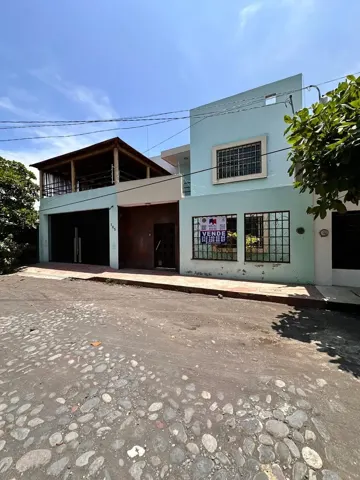
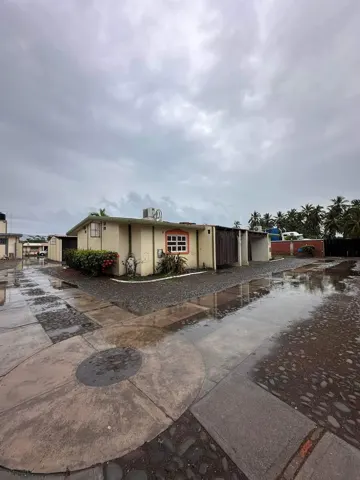
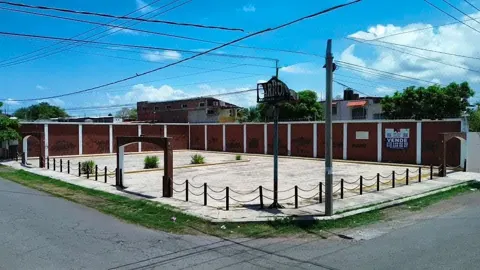
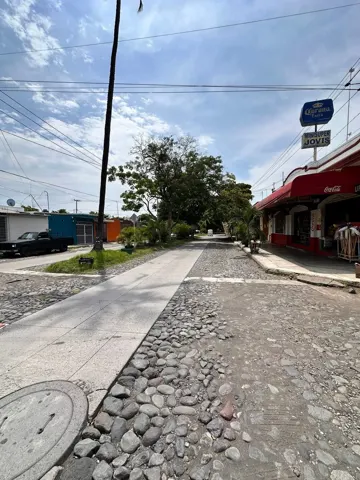
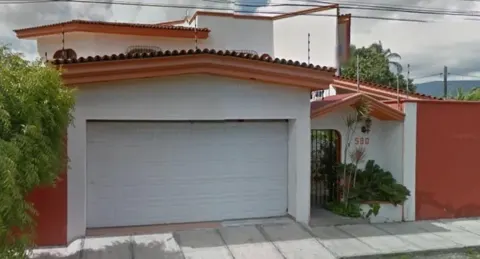
Featured homes for sale

Sources
Listings: agencies published on ViveMapa; SHF Índice de Precios de la Vivienda (2T 2026); INEGI Censo 2020 e Intercensal 2025; INEGI Censo de Población y Vivienda 2020 (ITER); INEGI DENUE 05/2026; SESNSP, incidencia delictiva municipal.