
Uaymitún
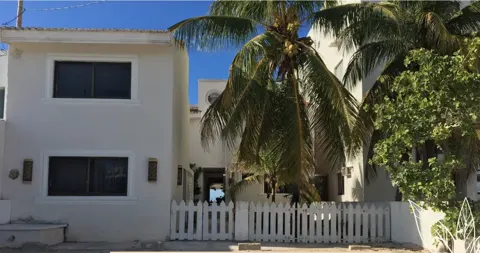
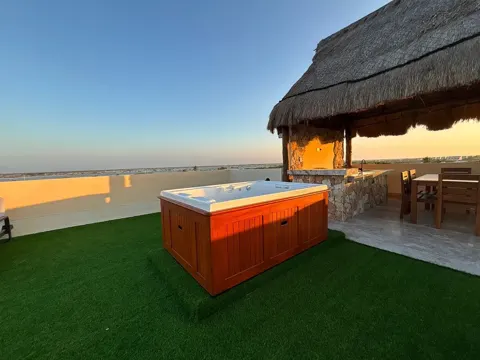
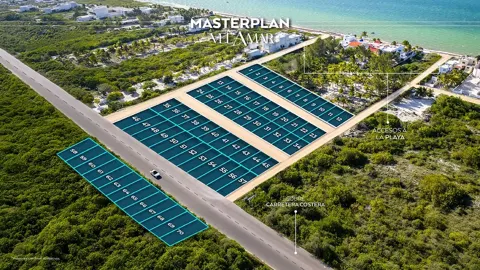
3 properties for sale and rent.
Photo: -Luyten- / Wikimedia Commons, Public domain
Prices in Uaymitún
For sale
- Listings here
- 3
- With a published price
- 3
- House: 1
- Apartment: 1
- Land: 1
Ratings
How we rate
Percentile rank among comparable zones (same amenity radius, or the same municipio set for security and price growth). score = 1 + floor(percentile / 20), capped at 5.
Nearby amenities
Within 3.0 km.
Nearest hospital: FUNDACIÓN PROGRESO YUCATAN A.C. (14.9 km).
Security
"Intentional homicides per 100,000 residents" counts the criminal cases the municipality's prosecutor's office opened for intentional homicide that year, scaled to a base of 100,000 residents so places of different sizes can be compared.
Progreso: 2.6 per 100,000 in 2025; Yucatan average: 1.4; peninsula average: 6.9.
Municipal reported-case figures (SESNSP), not victim counts and not specific to this neighbourhood or zone.
Growth and prices
Demographics
INEGI, Population and Housing Census 2020 (ITER)
| Indicator | Progreso municipality | Yucatán state |
|---|---|---|
| Population aged 0 to 14 | 23.5% | 23.8% |
| Population aged 15 to 64 | 67.5% | 67.5% |
| Population aged 65 and over | 9.0% | 8.7% |
| Average people per household | 3.6 | 3.5 |
| Occupied private dwellings | 18,503 | 658,085 |
| Average schooling, ages 15 and over (years) | 9.3 | 9.6 |
| Economically active population, ages 12 and over | 62.8% | 61.7% |
| Dwellings with internet | 69.9% | 53.6% |
INEGI, Population and Housing Census 2020 (ITER), at locality level. Age shares are of the population whose age was stated. A figure is missing where INEGI withholds it for a very small place.
Sources
- INEGI DENUE — 05/2026
- CLUES - Catalogo de Establecimientos de Salud — 2026-07
- SESNSP Incidencia Delictiva del Fuero Comun Municipal — 2023-2025
- INEGI Censo de Poblacion y Vivienda 2020 (ITER) — 2020
- INEGI Encuesta Intercensal 2025 — 2025
- SHF Indice de Precios de la Vivienda — 2T 2026

Common questions about Uaymitún
How do I ask about a listing on ViveMapa?
Write to us from the listing. We confirm availability and price and reply by email; your contact details are never published.