
Manzanillo, Colima
184 properties for sale and rent.
- Median price, sale
- $4,500,000 MXN
- Median per m²
- $27,974 MXN
- For sale
- 160
- For rent
- 24
- Municipality population, 2025 · INEGI Intercensal Survey
- 205,802
About Manzanillo
ViveMapa lists 184 properties in Manzanillo: 160 for sale and 24 for rent. The median asking price for sale is $4,500,000 MXN ($27,974 MXN per m²), based on the prices agencies publish. The municipality had 205,802 residents in 2025 according to INEGI's Intercensal Survey, +7.7% from 2020. The SHF housing price index for Manzanillo (municipal series) moved +59.6% over five years and +6.8% over the last year, to 2026T2. INEGI (DENUE) records 199 schools, 10 hospitals, 97 pharmacies in Manzanillo. In 2025 the intentional homicide rate was 117.1 per 100,000 residents (SESNSP), against 73.4 for the Colima average.
This summary is built only from the figures on this page and their sources, listed at the bottom.
Prices and property types
For sale
| Type | Listings | Median |
|---|---|---|
| All properties → | 160 | $4,500,000 MXN |
| Land → | 53 | $8,475,000 MXN |
| Apartment → | 40 | $3,609,500 MXN |
| House | 38 | $4,030,000 MXN |
| Hotel → | 7 | — |
| Condominium | 6 | — |
| Building | 4 | — |
| Commercial unit | 4 | — |
| Office | 4 | — |
Asking prices as agencies publish them, in the published currency. A median appears only where enough listings carry a price.
For rent
| Type | Listings | Median |
|---|---|---|
| All properties → | 24 | $18,000 MXN |
| Apartment → | 12 | — |
| House | 6 | — |
| Office | 3 | — |
| Condominium | 1 | — |
| Building | 1 | — |
| Land | 1 | — |
Asking prices as agencies publish them, in the published currency. A median appears only where enough listings carry a price.
Explore Manzanillo
More ways to search here
Other municipalities in Colima
Map and amenities
- Schools
- Hospitals
- Clinics
- Pharmacies
- Supermarkets
The points nearest the municipality centre, per category.
| Recorded in Manzanillo | # |
|---|---|
| Schools (43 private / 156 public) | 199 |
| Universities | 12 |
| Hospitals | 10 |
| Clinics | 258 |
| Pharmacies | 97 |
| Supermarkets | 7 |
| Convenience stores | 158 |
| Banks | 30 |
| Restaurants | 1,676 |
| Gyms | 45 |
INEGI DENUE count (05/2026) by the municipality's own code, not by radius.
Growth and prices
Housing price index, SHF (2T 2026) · municipal series: Manzanillo
Demographics of Manzanillo
INEGI, Population and Housing Census 2020 (ITER)
| Indicator | Manzanillo municipality | Colima state |
|---|---|---|
| Population aged 0 to 14 | 24.4% | 23.7% |
| Population aged 15 to 64 | 68.8% | 67.8% |
| Population aged 65 and over | 6.8% | 8.5% |
| Average people per household | 3.2 | 3.2 |
| Occupied private dwellings | 59,761 | 226,853 |
| Average schooling, ages 15 and over (years) | 10.1 | 10.1 |
| Economically active population, ages 12 and over | 66.1% | 65.3% |
| Dwellings with internet | 64.2% | 61.1% |
INEGI, Population and Housing Census 2020 (ITER), at locality level. Age shares are of the population whose age was stated. A figure is missing where INEGI withholds it for a very small place.
Security
"Intentional homicides per 100,000 residents" counts the criminal cases the municipality's prosecutor's office opened for intentional homicide that year, scaled to a base of 100,000 residents so places of different sizes can be compared.
Manzanillo: 117.1 per 100,000 in 2025; Colima average: 73.4; national average: 15.5.
2026, January to August (8 months, year to date): 64.1 intentional homicides per 100,000; not comparable with the full years.
Municipal reported-case figures (SESNSP), not victim counts and not specific to this neighbourhood or zone.
Featured homes for sale
-
-
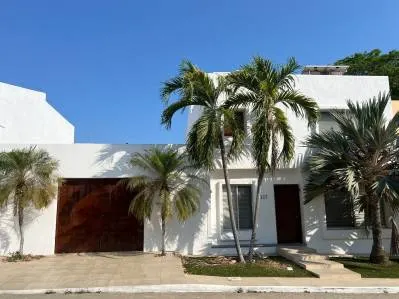 For sale, one of the most beautiful homes in the Real del Country in Manzanillo
Manzanillo, Colima
$5,195,000 MXN
4 bd · 3 ba · 375 m²
-
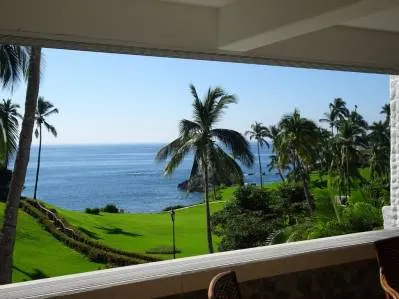 Great apartment for sale in vida del mar, manzanillo
Manzanillo, Colima
$3,295,000 MXN
1 bd · 2 ba · 128 m²
-
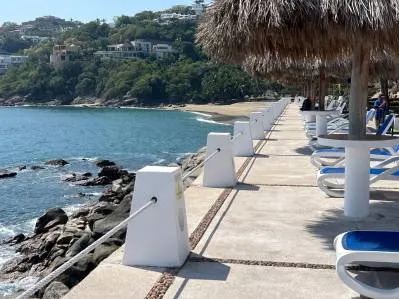 For Sale... Experience luxury and tranquility at Puerto Las Hadas, Manzanillo!
Manzanillo, Colima
$6,500,000 MXN
2 bd · 2 ba · 189 m²
-
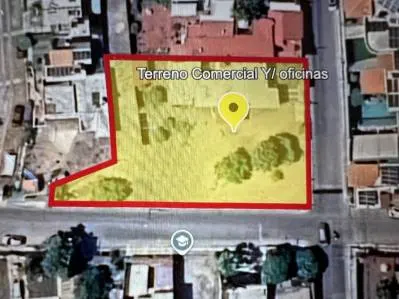 Great Investment Opportunity in the Heart of Manzanillo ¡
Manzanillo, Colima
$19,000,000 MXN
4 bd · 2.5 ba · 254 m²
-
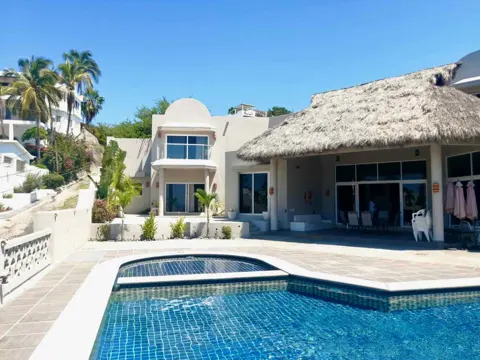 🏡 Casa de Lujo en Venta en Loma Bonita – Diseño Exclusivo.
Manzanillo, Colima
$18,000,000 MXN
5 bd · 6 ba · 845 m²
-
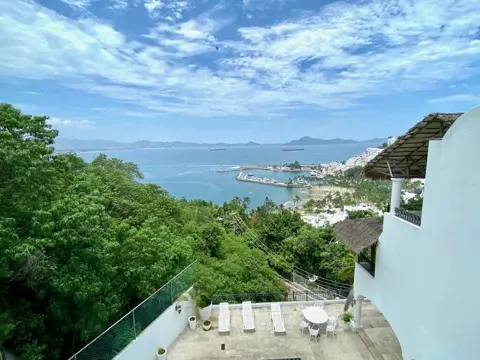 Hermosa Villa, localizada sobre Avenidas de los Riscos, dentro de la Península de Santiago.
Manzanillo, Colima
$8,500,000 MXN
3 bd · 3 ba · 208 m²
-
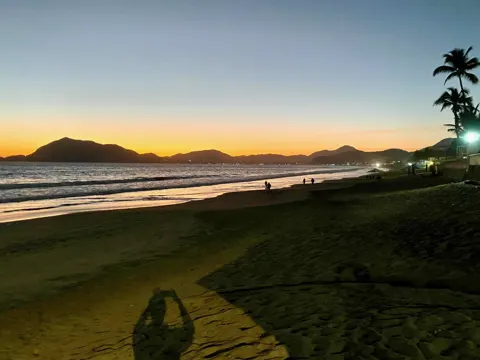 Propiedad Frente al mar con Casa en Olas Altas 26, Santiago, Manzanillo.
Manzanillo, Colima
$10,400,000 MXN
6 bd · 5 ba · 273 m²
-
-
-
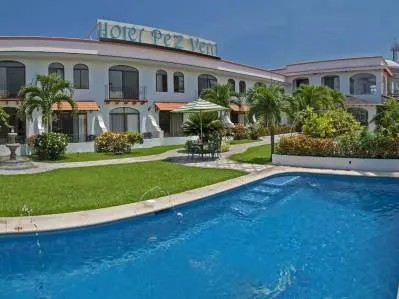 Hotel for sale in Manzanillo, Colima, Great opportunity!!!!
Manzanillo, Colima
$45,000,000 MXN
21 bd · 23 ba · 1965 m²
-
 Oceanfront Apartment for Sale in "Las Hadas" Zone
Manzanillo, Colima
$3,990,000 MXN
2 bd · 2 ba · 100 m²
Common questions about Manzanillo
How much does it cost to buy in Manzanillo?
The median asking price to buy in Manzanillo is $4,500,000 MXN, about $27,974/m², across 160 properties for sale listed on ViveMapa.
What kind of property is most common for sale in Manzanillo?
The most common type for sale in Manzanillo is land: 53 of 160 listings. Use the type filter to see only houses, apartments or land.
What is the cheapest kind of property for sale in Manzanillo?
Among houses, apartments and land, apartment has the lowest median price for sale in Manzanillo: $3,609,500 MXN.
How much does it cost to rent in Manzanillo?
The median asking rent in Manzanillo is $18,000 MXN, about $217/m², across 24 properties for rent listed on ViveMapa.
What kind of property is most common for rent in Manzanillo?
The most common type for rent in Manzanillo is apartment: 12 of 24 listings. Use the type filter to see only houses, apartments or land.
How do I ask about a listing on ViveMapa?
Write to us from the listing. We confirm availability and price and reply by email; your contact details are never published.
Sources
Listings: agencies published on ViveMapa; SHF Índice de Precios de la Vivienda (2T 2026); INEGI Censo 2020 e Intercensal 2025; INEGI Censo de Población y Vivienda 2020 (ITER); INEGI DENUE 05/2026; SESNSP, incidencia delictiva municipal.